Revision of the EU Hydrogen Strategy for Industry
During my recent application process, I was asked to prepare a presentation on the revision of the EU Hydrogen Strategy.
In the end, another candidate turned out to be a better fit for the role. That happens, and it’s part of any competitive process.
At the same time, I remain confident that my qualifications and the strategic depth of my presentation were very strong. The task clearly demonstrated my ability to develop a structured, forward-looking policy strategy, grounded in regulation, market realities, and industrial needs.
This exercise itself confirmed something important for me: the revision of the EU Hydrogen Strategy will be a decisive moment for Europe’s industrial decarbonisation.
So I’d like to briefly share a few reflections.
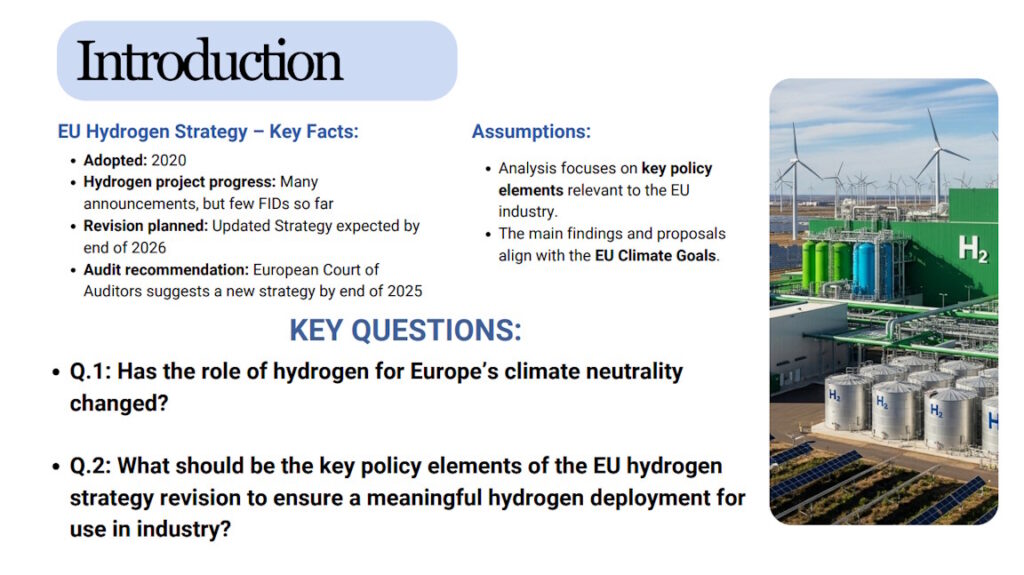
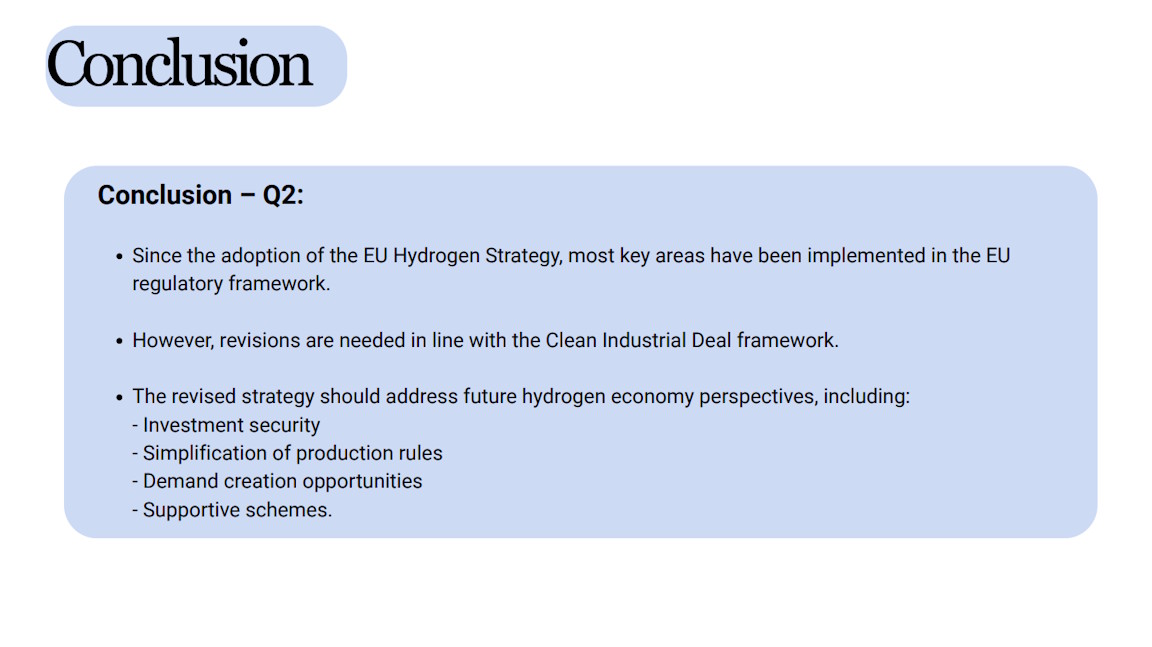
Since the adoption of the EU Hydrogen Strategy in 2020, we’ve seen:
- strong political ambition,
- an impressive number of project announcements,
- but still too few final investment decisions.
This gap is no longer about vision. It’s about implementation, prioritisation, and bankability, and this is where strategic policy design becomes critical.
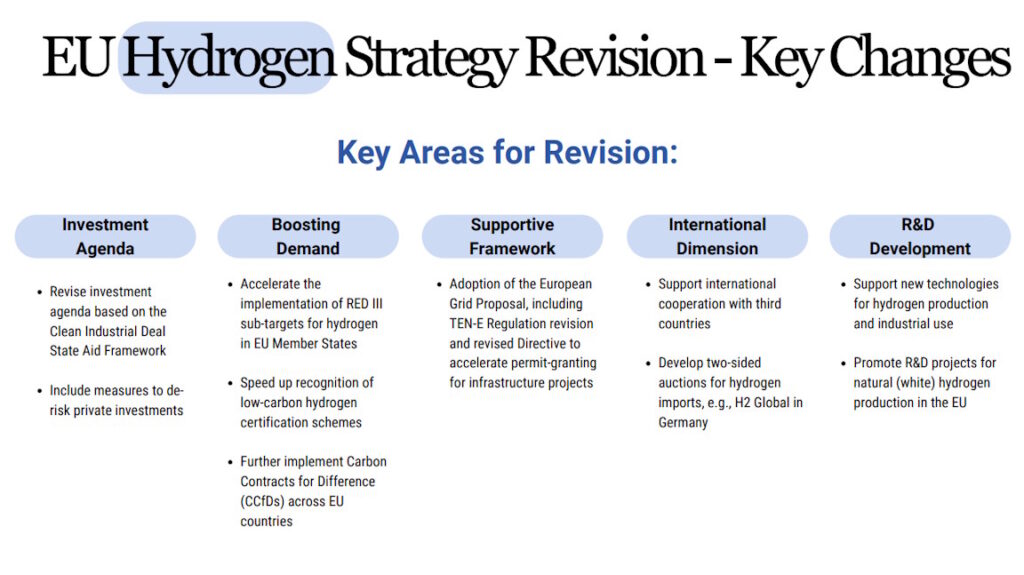
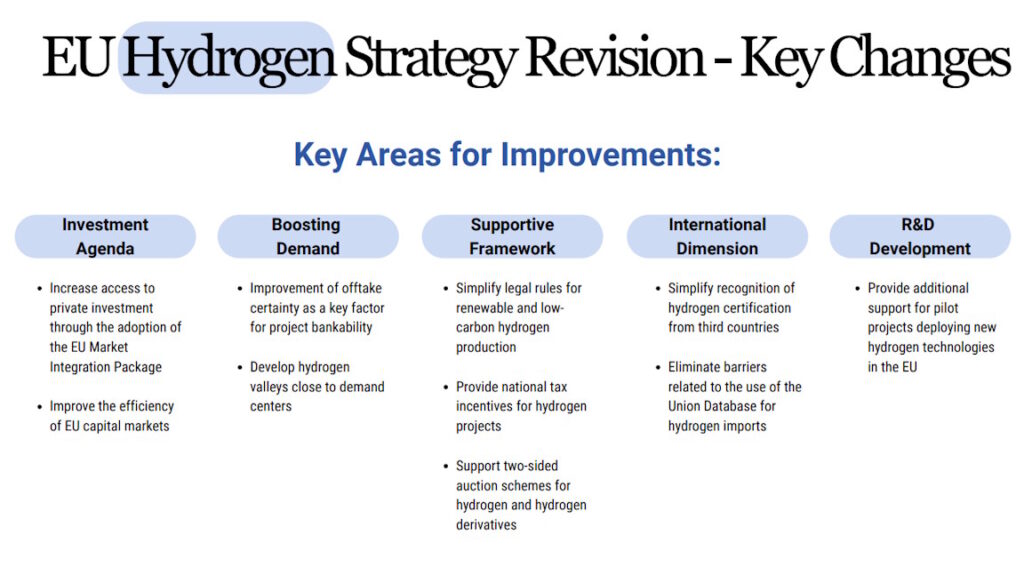
Looking ahead, a revised EU Hydrogen Strategy should focus less on targets alone and more on:
- investment security and risk-sharing instruments
- real demand creation and offtake certainty
- simpler and more predictable rules for renewable and low-carbon hydrogen
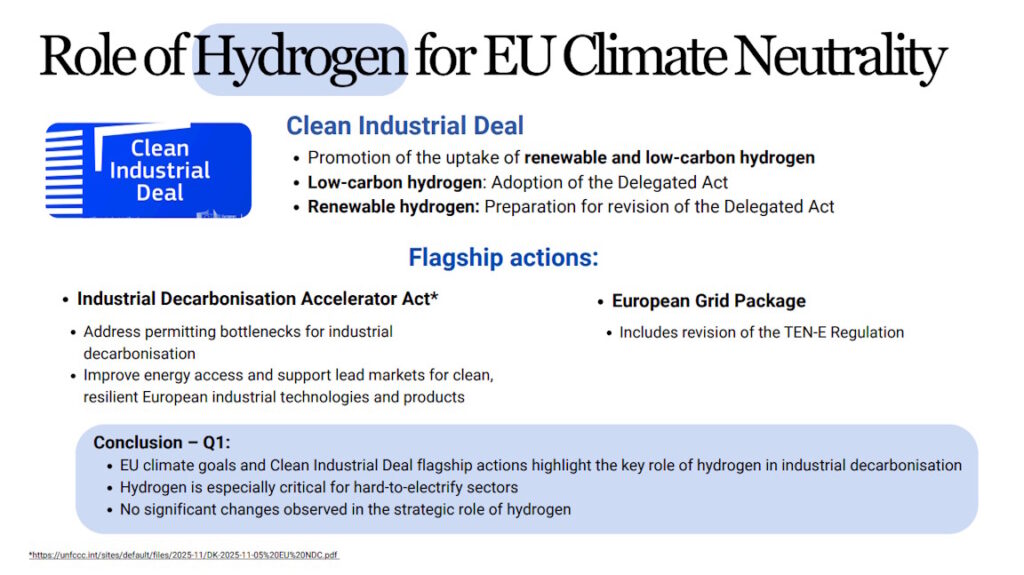
- alignment with the Clean Industrial Deal and industrial competitiveness
- an effective international dimension, including imports and certification.
Hydrogen remains essential for hard-to-electrify industrial sectors. Its strategic role hasn’t diminished, but the policy framework now needs to mature from ambition to delivery.
Grateful for the opportunity to think this through and always happy to exchange views with others working on Europe’s hydrogen future.