News on the Hydrogen and Guarantees of Origin Market
The latest EU report titled “Technical assistance to monitor functioning of the guarantees of origin (GO) system” provides an in-depth look at the GOs market and its impact on renewable energy and hydrogen tracking.
✅ Key Takeaways
📌 The GO market has achieved a healthy level of liquidity.
📌 While transparency has improved, price discovery remains limited. GO prices vary based on factors such as technology, region, and additionality – factors not always visible to consumers. Forecasting prices remains difficult due to elements of monopolistic competition.
📌 More than 90% of hydropower, 50% of wind, and 30% of solar electricity production in Europe is currently tracked via GOs.
📌 The GO system is effective in tracking renewable electricity, but further harmonization is needed to reduce the risk of misuse.
📌 Hydrogen
- As of the end of 2023: only 0.4% of EU hydrogen production was based on water electrolysis (45 tonnes or 1.5 GWh).
- An additional 9.2% (1,033 tonnes or 34 GWh) was produced as a green by-product (e.g., from chlor-alkali electrolysis).
- The Hydrix index (as of January 2025) estimates green hydrogen prices in Germany at €7.80–€9.50/kg, roughly 2.5x higher than grey hydrogen (€3–€4/kg).
📌 Hydrogen GO trading volumes
- RFNBO certification has only been possible since December 2024.
- Until now, certified green hydrogen has only been traded via GOs or Non-Governmental Certificates (NGCs).
- Assuming certification, 1,500 GOs could have been issued in 2023 for hydrogen produced via electrolysis.
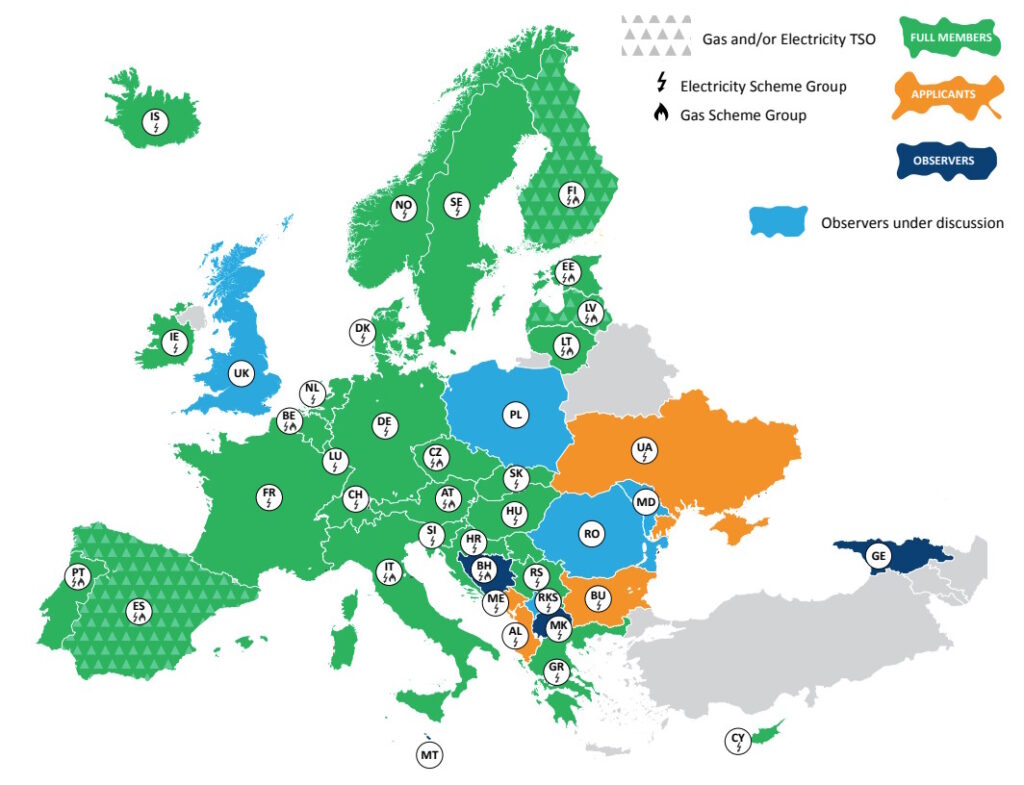
- While only a few EU Member States are active in the gas GO market and even fewer support EU-wide GO trading, interest in GOs is growing:
- Smaller projects often opt for GOs/NGCs due to lack of RFNBO compliance.
- Larger projects (many pre-FID) are preparing for RFNBO certification to benefit from offtake obligations under the compliance market.
➡️ Source: Technical assistance to monitor functioning of the guarantees of origin (GO) system