Latest news

2025 Carbon Market Report

2025 Carbon Market Report on the functioning of the European carbon market in 2024

On 3 December 2025, the European Commission published the 2025 Carbon Market Report, confirming that the EU Emissions Trading System (EU ETS) continues to function effectively and remains a key pillar of Europe’s climate policy.

As part of the State of the Energy Union Report, the assessment:

▪️ Reviews EU ETS performance in 2024 and early 2025
▪️ Confirms the continued decline in emissions across power and industry.

✅ Key takeaways:

🔹 Overall progress

  • EU ETS emissions from power and industry are now around 50% below 2005 levels.
  • The system remains on track for the 2030 target: –62% emissions

🔹 Power & Industry

  • 2024 emissions from power installations fell by almost 11% compared to 2023
  • Overall fuel combustion emissions across power + industry declined by 9%

🔹 Aviation

  • EU ETS prices for intra-European aviation increased around 15% in 2024
    • ➡️ Key Drivers: continued growth in aviation emissions and expanded coverage, including flights to the EU’s outermost regions
  • The EU ETS also started rewarding airlines for their use of sustainable aviation fuels (SAF) through additional allowance allocation, and the EU became the first jurisdiction to introduce monitoring and reporting of non-CO2 aviation effects.
  • SAF incentives under EU ETS
    • The ETS carbon price already provides an incentive of around EUR 200 per tonne of SAF used, compared to fossil kerosene.
    • Additional ETS support measures implemented in 2025: €500 – €7,000 per tonne of eligible SAF on ETS routes and applicable since 1 January 2024.
    • For 2024, the incentive from EU ETS was worth around EUR 25 million, supplemented by ETS support of about 1.3 million allowances worth approximately EUR 100 million
  • CORSIA alignment
    • Limited intra-European EU ETS scope extended to end-2026
    • Full application of ICAO CORSIA expected from 2027

🔹 Maritime

  • 2024 marked the inclusion of shipping in the EU ETS
  • Coverage:
    • 100% of emissions between EEA ports & at EEA ports
    • 50% of emissions from voyages to/from non-EEA ports
  • Compliance was high: shipping companies surrendered allowances for more than 99% of their relevant surrendering requirements by the 30 September deadline.
  • In 2025, shipping companies surrendered allowances for 40% of their 2024 emissions

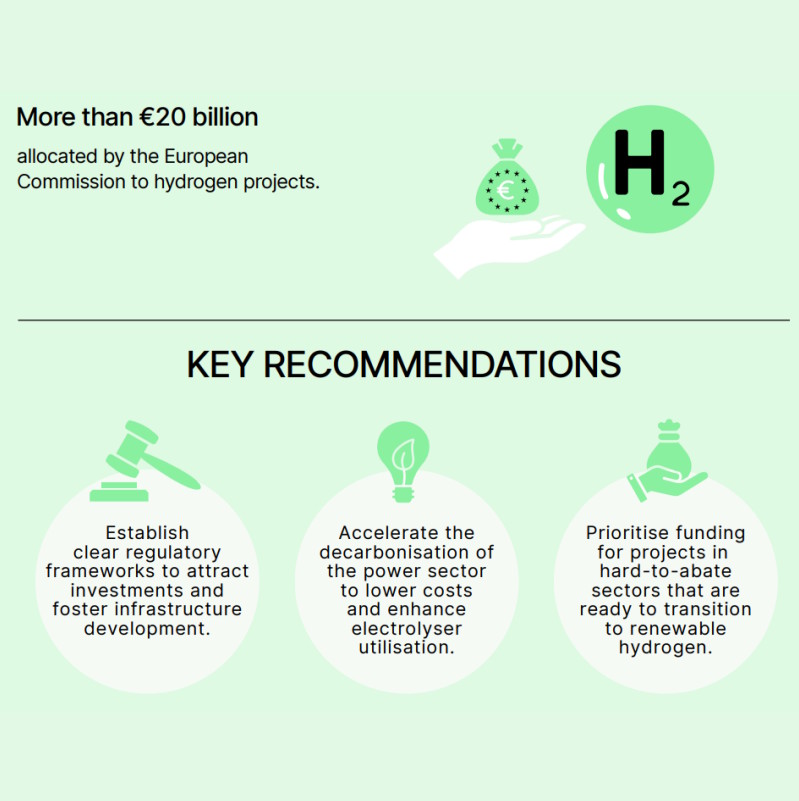
🔹 EU ETS funding the clean transition

  • €38.8 billion raised in 2024
  • Revenues support:
    • National climate action
    • Clean energy investments
    • Innovation Fund
    • Modernisation Fund
    • Recovery & Resilience Facility (REPowerEU)

☑️ Total ETS revenues now exceed €250 billion

➡️ Source: 2025 Carbon Market Report: EU ETS lowers power sector emissions and expands to maritime transport

New EU funding opportunities

🚀 On 4 December 2025, the European Commission has launched three major new funding opportunities under the EU Innovation Fund, mobilising €5.2 billion from EU ETS revenues to support the scale-up of net-zero technologies, clean hydrogen production, and industrial heat decarbonisation.

✅ Main Funding Opportunities:

🔹 IF25 Net-Zero Technologies Call – €2.9 billion

📌 Supporting innovative, mature decarbonisation projects across various scales, including manufacturing of components for:

  • Renewables & energy storage
  • Heat pumps
  • Hydrogen production
  • EV batteries

📌 Projects are assessed on GHG reduction potential, innovation, maturity, replicability, and cost efficiency.

📌 A new bonus point is introduced for projects led exclusively by SMEs, recognising their role in driving innovation.

📅 Info Day: 16 December 2025

🔹 3rd Auction of the European Hydrogen Bank – €1.3 billion

📌 Scaling up production of RFNBO hydrogen and electrolytic low-carbon hydrogen, including a new topic for aviation and maritime off-takers.

📌 Support is provided via a fixed premium per kg of verified hydrogen produced for up to 10 years, increasing price certainty and bankability for projects.

📅 Info Day: 10 December 2025

🔹 1st Auction for Decarbonising Industrial Process Heat – €1 billion

📌 The auction dedicated to industrial process heat, targeting one of Europe’s largest unaddressed emissions sources.

📌 Supported technologies include:

  • Heat pumps & electric boilers
  • Resistance & induction heating
  • Solar thermal & geothermal heat
  • Hybrid solutions

📌 Funding is granted as a fixed premium per unit of verified decarbonised heat for up to 5 years, awarded to the most cost-effective CO₂ abatement projects.

📅 Info Day: 16 December 2025

Member States can complement EU funding for high-scoring projects that miss out due to budget limits:

📌 Germany: additional €1.3 billion for RFNBO hydrogen projects

📌 Spain: €465 million total:

  • €415 million for hydrogen
  • €50 million for industrial heat decarbonisation

☑️ What’s next?

📌 Applicants are strongly encouraged to attend the Info Day.

📌 Signing of grant agreements:

  • NZT projects – expected Q1 2027
  • Auction projects – within 9 months of call closure.

➡️ Source: €5.2 billion of EU Emissions Trading revenues earmarked for clean transition technologies under the Innovation Fund

ACER’s European hydrogen markets 2025 Monitoring Report

The ACER’s European hydrogen markets provides 2025 Monitoring Report a realistic snapshot of the current state of development of the European hydrogen market.

✅ Key Takeaways:

📌 As of October 2025, only two Member States, Denmark and Ireland, have notified the Commission of the completion of RED III transposition.

📌 Despite a strong 51% annual increase in installed electrolyser capacity in the EU in 2024, the installed capacity of 308 MW (2024) and the 1.8 GW capacity under construction still fall well short of a realistic trajectory toward the 2030 EU (40 GW) and Member States (48-54 GW) targets.

📌 At around 8 EUR/kgH2, the average cost of RFNBO hydrogen in the EU currently remains four times higher than that of conventional hydrogen from natural gas (just over 2 EUR/kg).

📌 Electricity supply costs, excluding grid tariffs, may account for up to 50% of the levelised cost of renewable hydrogen, depending on the electricity supply mix, with substantial regional variations across the EU.

📌 Uncertain future demand for renewable hydrogen, driven by the current cost, makes it difficult for hydrogen network operators (HNOs) to align network development with demand evolution, increasing the financial risks associated with this uncertainty. Adaptive network planning, reflecting the latest market trends, is essential to ensure efficient investment and cost control.

📌 Low-carbon hydrogen produced from natural gas with carbon capture and storage (CCS) could support market development and accelerate decarbonisation in some sectors. With current production cost estimates at just below 3 EUR/kg, low-carbon hydrogen with CCS is more competitive than renewable hydrogen.

📌 Funding availability is increasing, but implementation remains slow. The European Commission has allocated more than €20 billion through various hydrogen-related programmes, including auctions under the European Hydrogen Bank. In addition, the EU Hydrogen Mechanism has been launched to facilitate supply–demand matching and accelerate hydrogen market creation.

➡️ Source: The European Union Agency for the Cooperation of Energy Regulators. European hydrogen markets 2025 Monitoring Report

Small Modular Reactors – Future Development and Deployment in Europe

Public consultation. Small Modular Reactors. Future development and deployment in Europe

📢 Call for Evidence: “Small Modular Reactors – Future Development and Deployment in Europe”

On 6 November, the European Commission launched a public consultation to help shape the upcoming EU Strategy on Small Modular Reactors (SMRs).

🗓️ Open until: 4 December 2025

➡️ Participate here: Small modular reactors – future development and deployment in Europe

✅ What is this initiative about?

📌 The Commission plans to adopt an SMR Strategy in Q1 2026 (via a Commission Communication) aimed at creating a supportive industrial, economic, and policy framework to accelerate SMR deployment across Europe with first projects expected in the early 2030s.

📌 The strategy seeks to:

  • Strengthen the competitiveness of the EU industry;
  • Foster innovation in nuclear technologies;
  • Provide a coherent EU approach, complementing national initiatives.

☑️ Why does it matter?

📌 More than 10 EU Member States have already expressed interest in deploying SMRs as part of their national energy and climate plans.

📌 SMRs are seen as a potential source of clean, flexible electricity and heat for residential and industrial use, including low-carbon hydrogen and efuel production.

📌 Key advantages include simplified design, enhanced safety features, factory production, reduced construction and operational costs, flexibility for multiple energy uses, and contributions to grid stability.

✅ Strategy objectives:

Building on the work of the European Industrial Alliance on SMRs, the upcoming Communication will focus on:

  • Strengthening collaboration to develop a robust EU supply chain
  • Enhancing regulatory cooperation and streamlining licensing processes
  • Reinforcing EU leadership in research and innovation, including start-up and scale-up partnerships
  • Securing a reliable nuclear fuel cycle
  • Preserving and developing skills and expertise across Europe
  • Addressing investment barriers
  • Supporting public engagement and trust-building initiatives

Climate Change Performance Index 2026

📢 The Climate Change Performance Index 2026 illustrates how the regulatory framework influences the achievement of climate targets.

The Climate Change Performance Index (CCPI) is an independent monitoring tool for the climate mitigation performance of 63 countries and the EU.

✅ Key Takeaways:

📌 No country is strong enough in all categories to achieve an overall very high rating. Therefore, the top three places continue to be vacant.

📌 Denmark remains the top-ranked country but falls short of earning an overall very high rating.

📌 Overall, the EU falls three spots, to 20th, and has a medium overall ranking.

📌 Eight EU countries are among the high performers, with Denmark (4th) and Luxembourg (8th) upfront.

📌 No EU country receives an overall very low rating. Bulgaria, at 51st, is still the worst-performing EU country, as nine other EU countries receive an overall low ranking.

📌 The European Union (EU):

  • It ranks 20th in this year’s CCPI, down three spots from last year and receives medium ratings across the board in: GHG Emissions, Renewable Energy, Energy Use, and Climate Policy;
  • The CCPI experts question the likelihood of member states’ full implementation of the revised National Energy and Climate Plans (NECP) regarding the 2030 target published in May 2025
  • RED III provides a policy framework with an overall EU minimum binding target of 42.5%, although the experts criticise the lack of national binding targets and weak enforcement.
  • Implementation remains a major gap, with the European Commission having launched infringement procedures against 26 member states for non-compliance.

📌 Germany

  • Germany drops six places to 22nd in this year’s CCPI;
  • Planned gas power capacity risks a fossil fuel lock-in;
  • The overall ranking decline can be attributed to its announcements to weaken existing climate legislation and unnecessarily expand gas power plants.
  • Hydrogen ramp-up and the development of a capacity market, for when RE does not generate sufficient power, are also moving too slowly. Offshore and onshore wind expansion remain below what is needed.

📌 The United States:

  • The United States falls eight spots from 57th to 65th and remains a very low performing country.
  • Key policies supporting renewable energy build-up and GHG emissions reduction have been revoked alongside promotion of fossil fuel expansion.
  • Key support schemes from the Inflation Reduction Act, such as the Environmental  Protection Agency’s Solar for All program and clean energy tax credits, have been rescinded or weakened.
  • Some states, such as New York and California, still have policies in place to combat climate change and legislators strive to protect these from national-level policies and decrees through the U.S. Climate Alliance.

➡️ Source: Climate Change Performance Index. Ranking

New Technologies in the Energy Sector

In October 2025, the U.S. Department of Energy (DOE) released its Fusion Science and Technology Roadmap

In October 2025, the U.S. Department of Energy (DOE) released its Fusion Science and Technology Roadmap, a national strategy to accelerate the development and commercialization of fusion energy on the most rapid, responsible timeline in history.

➡️ Source: Energy Department Announces Fusion Science and Technology Roadmap to Accelerate Commercial Fusion Power

✅ What is Nuclear Fusion?

  • Nuclear fusion is the process where two light atomic nuclei combine to form a heavier one, releasing massive amounts of energy.
  • Fusion reactions occur in plasma, a hot, charged gas of ions and free electrons with properties distinct from solids, liquids, or gases.
  • The Sun and all stars are powered by this reaction.

➡️ Source: What is Nuclear Fusion?

☑️ Key Takeaways:

📌 The Roadmap guides the emerging U.S. fusion private sector toward maturity, targeting actions and milestones through the mid-2030s.

📌 Build-Innovate-Grow is DOE’s new strategy to support fusion energy commercialization in the U.S. and its tool is the Roadmap.

📌 The Roadmap defines a new era of U.S. fusion energy leadership by setting ambitious goals to deliver fusion power on an aggressive timeline, accelerated by the revolutionary potential of Artificial Intelligence (AI)-Fusion convergence.

📌 The Roadmap defines Key Actions to be executed in the near-term (next 2-3 years), mid-term (3-5 years) and long-term (5-10 years), aligned to the Build-Innovate-Grow strategy. DOE will build Fusion Science & Technology infrastructure and the AI-Fusion digital convergence platform.

✅ Is this A New Era of U.S. Fusion Energy Leadership?

📌 The U.S. has led innovation in nuclear fusion since the 1940s with significant fusion research carried out during the Manhattan Project.

📌 In the 1950s, the U.S. launched Project Matterhorn under the Atomic Energy Commission (AEC), an effort that later became part of the DOE fusion program.

📌 The theoretical framework for compressing and heating fusion fuel using powerful energy drivers was also established through early work in the 1960s and 1970s.

📌 Since the early 1990s, the U.S. developed some of the world’s most sophisticated multi-physics computational codes validated with world-leading diagnostic tools on world-class domestic facilities.

📌 In the 2000s, fusion technology activity began to grow modestly in the U.S. under the APEX and ALPS programs.

📌 In the 2010s the advent of high-performance computing and the understanding of burning plasma physics ushered in a predictive capability that has brought forth confidence in a path forward to the commercialization of fusion energy.

📌 Today, the U.S. hosts the fastest-growing private fusion sector, attracting $9B+ in private investment and home to 29 fusion companies, the largest globally, including three with over $1B each.

Green Hydrogen & RFNBO Criteria

Institute of Energy Economics at the University of Cologne gGmbH (EWI). Green hydrogen production under RFNBO criteria ‐ Analyzing the system and business case perspective.

Today I took a closer look at a new EWI study: “Green hydrogen production under RFNBO criteria – Analyzing the system and business case perspective” (2025).

✅ Key Takeaways:

This analysis examines the impact of the RFNBO criteria on green hydrogen production from system and business perspectives, with particular attention to how the criteria affect costs, capacity expansion, and the need for system flexibility.

📌 From a system perspective:

  • Implementing all RFNBO criteria increases electrolysis capacity by over 3% across Europe to meet predefined demand, while average full-load hours decline by around 200 hours.
  • Applying all RFNBO criteria with hourly matching increases average hydrogen supply costs by around 10 EUR/MWh (+8%) across Europe, driven primarily by additionality requirements and the shift from daily to hourly matching.
  • In Germany, expected to be the largest hydrogen offtaker in Europe, the impact on marginal hydrogen costs is higher than the EU average (+16%).
  • These effects highlight distributional impacts between sectors: while marginal electricity costs decline due to surplus renewables entering the market, additional system costs remain within the hydrogen sector. This implies a cost shift from electricity consumers to hydrogen producers.
  • Average EU electricity costs fall by around 5%, and marginal CO₂ certificate costs by around 2%.
  • Applying all RFNBO criteria adds over 25 GWel of additional RES capacity across Europe. In Germany, total installed RES capacity increases by 17%.
  • Adding RFNBO criteria reallocates capacities from the electricity market to hydrogen production.
  • With stricter temporal correlation requirements, hydrogen production increasingly relies on RES with high full-load hours (onshore and offshore wind), leaving more volatile solar generation to the electricity market.

📌 From a business perspective:

  • Tighter matching requirements push portfolios toward dedicated renewables and short-term flexibility.
  • Under Hourly Matching and a baseload supply profile, PV is often combined with large batteries; adding hydrogen storage can shift flexibility from the electricity sector to the hydrogen sector.
  • Results show that LCOH are more sensitive to constraints from the business perspective: in the baseline, they rise from around 150 EUR/MWh (No Criteria) to almost 180 EUR/MWh (Hourly Matching), an increase of +19%, with the largest jump occurring between Daily and Hourly Matching.
  • Sensitivity analyses reveal a much stronger impact than in the system perspective, especially under Hourly Matching, where LCOH range from about 170 EUR/MWh up to 370 EUR/MWh.
  • The difference between Monthly and Hourly Matching spans from roughly 15 EUR/MWh to over 90 EUR/MWh.

➡️ Source: EWI (2025). Green hydrogen production under RFNBO criteria ‐ Analyzing the system and business case perspective.

Hydrogen Mechanism

🔹 New milestone for the EU hydrogen market! 🔹

On 12 November, the European Commission launched the first call for interest under the Hydrogen Mechanism, which is a key step to connect potential suppliers and buyers of renewable and low-carbon hydrogen and its derivatives across the EU.

🔗 Official announcement

🔗 Hydrogen Mechanism platform

💡 What is the Hydrogen Mechanism?

An online platform that supports market development for renewable and low-carbon hydrogen and its derivatives, such as ammonia, methanol, and electro-sustainable aviation fuel (eSAF).

📅 Key timeline:

  • 12 Nov 2025 – 2 Jan 2026: Submission phase: Suppliers are invited to submit supply offers.
  • 19 Jan 2026: Publication of anonymised supply offers.
  • 19 Jan – 20 Mar 2026: Off-takers express their interest.
  • 31 Mar 2026: Results available to participants.

➡️ Why it matters:

  • Connects future demand and supply, reducing market uncertainty;
  • Increases transparency and visibility of potential partners;
  • Facilitates hydrogen infrastructure and financing access;
  • Encourages market engagement and new business opportunities.

The Hydrogen Mechanism is another important step toward building a hydrogen market.

World Energy Outlook 2025

International Energy Agency. World Energy Outlook 2025

☑️ The World Energy Outlook 2025 (WEO-2025) of International Energy Agency considers the following scenarios:

📌 Current Policies Scenario (CPS): A snapshot of policies and regulations that are already in place.

📌 Stated Policies Scenario (STEPS): Encompasses a broader range of policies, including those that have been formally proposed but not yet adopted, as well as other official strategy documents that indicate the intended direction of policy.

📌 Net Zero Emissions by 2050 Scenario (NZE Scenario): Describes a pathway to reduce global energy-related CO₂ emissions to net zero by 2050, while recognising that each country will follow its own route.

☑️ Key Takeaways

📌 Electricity

  • Electricity demand grows much faster than overall energy use in all scenarios: it rises by around 40% to 2035 in both the CPS and the STEPS, and by more than 50% in the NZE Scenario.
  • Electricity currently accounts for only 21% of total final energy consumption globally, yet it is the key energy source for sectors representing over 40% of the global economy, and the main energy source for most households.
  • A pivotal issue for electricity security is the pace at which new grids, storage facilities, and other sources of power system flexibility are developed.
  • Investments in electricity generation have surged by almost 70% since 2015, reaching USD 1 trillion per year, while annual grid spending has increased at less than half that pace to around USD 400 billion.
  • The explosive growth in electricity demand for data centres and AI is concentrated in advanced economies and China. Investment in data centres is expected to reach USD 580 billion in 2025. A tripling of electricity consumption by data centres by 2035 will represent less than 10% of total global electricity demand growth, but it will be highly concentrated geographically. More than 85% of new data centre capacity additions over the next ten years are expected in the United States, China, and the European Union.

📌 Renewables

  • Renewables grow faster than any other major energy source in all scenarios, led by solar photovoltaics.

📌 Nuclear Power

  • Another common element across scenarios is the revival of nuclear energy, with investment rising in both traditional large-scale plants and new designs, including small modular reactors (SMRs).
  • More than 40 countries now include nuclear energy in their strategies and are taking steps to develop new projects.

➡️ Source: International Energy Agency. World Energy Outlook 2025

Sustainable Transport Investment Plan

Sustainable Transport Investment Plan

✈️ 🚢 EU launches the Sustainable Transport Investment Plan (STIP), accelerating renewable and low-carbon fuels for aviation and maritime transport

On 5 November 2025, the European Commission has unveiled its Sustainable Transport Investment Plan (STIP), a strategic roadmap to scale up investments in renewable and low-carbon fuels for the aviation and waterborne transport sectors.

This initiative marks a crucial step in delivering the ReFuelEU Aviation and FuelEU Maritime goals and strengthening Europe’s industrial leadership in sustainable fuels.

✅ Key highlights:

📌 Around 20 million tonnes of sustainable alternative fuels (13.2 Mt biofuels and 6.8 Mt e-fuels) will be needed by 2035.

📌 Estimated €100 billion investment is required to meet these targets.

📌 The EU aims to mobilise €2.9 billion by 2027, including:

  • €2 billion via InvestEU for sustainable fuel projects.
  • €300 million through the European Hydrogen Bank for SAF and SMF hydrogen production.
  • €133 million for R&I projects under Horizon Europe.
  • €446 million from the Innovation Fund for synthetic aviation and maritime fuel projects.
  • Launch of an eSAF Early Movers Coalition to mobilise €500 million for synthetic aviation fuel projects.

☑️ The STIP builds on three pillars:

📌 Strategic framework – identifying investment gaps and needs.

📌 Financing action – unlocking and de-risking private investments.

📌 External dimension – fostering global cooperation and fair competition for EU fuel producers.

By creating regulatory stability and new financing tools, STIP aims to make Europe a frontrunner in sustainable transport fuels, driving innovation, industrial leadership, and climate neutrality by 2050.

➡️ Source: Commission unveils the Sustainable Transport Investment Plan: a strategic approach to boost renewable and low-carbon fuels for aviation and waterborne transport