Climate Change Performance Index 2026

πŸ“’ The Climate Change Performance Index 2026 illustrates how the regulatory framework influences the achievement of climate targets.
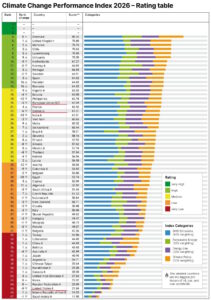
The Climate Change Performance Index (CCPI) is an independent monitoring tool for the climate mitigation performance of 63 countries and the EU.

βœ… Key Takeaways:

πŸ“Œ No country is strong enough in all categories to achieve an overall very high rating. Therefore, the top three places continue to be vacant.

πŸ“Œ Denmark remains the top-ranked country but falls short of earning an overall very high rating.

πŸ“Œ Overall, the EU falls three spots, to 20th, and has a medium overall ranking.

πŸ“Œ Eight EU countries are among the high performers, with Denmark (4th) and Luxembourg (8th) upfront.

πŸ“Œ No EU country receives an overall very low rating. Bulgaria, at 51st, is still the worst-performing EU country, as nine other EU countries receive an overall low ranking.

πŸ“Œ The European Union (EU):

  • It ranks 20th in this year’s CCPI, down three spots from last year and receives medium ratings across the board in: GHG Emissions, Renewable Energy, Energy Use, and Climate Policy;
  • The CCPI experts question the likelihood of member states’ full implementation of the revised National Energy and Climate Plans (NECP) regarding the 2030 target published in May 2025
  • RED III provides a policy framework with an overall EU minimum binding target of 42.5%, although the experts criticise the lack of national binding targets and weak enforcement.
  • Implementation remains a major gap, with the European Commission having launched infringement procedures against 26 member states for non-compliance.

πŸ“Œ Germany

  • Germany drops six places to 22nd in this year’s CCPI;
  • Planned gas power capacity risks a fossil fuel lock-in;
  • The overall ranking decline can be attributed to its announcements to weaken existing climate legislation and unnecessarily expand gas power plants.
  • Hydrogen ramp-up and the development of a capacity market, for when RE does not generate sufficient power, are also moving too slowly. Offshore and onshore wind expansion remain below what is needed.

πŸ“Œ The United States:

  • The United States falls eight spots from 57th to 65th and remains a very low performing country.
  • Key policies supporting renewable energy build-up and GHG emissions reduction have been revoked alongside promotion of fossil fuel expansion.
  • Key support schemes from the Inflation Reduction Act, such as the Environmental  Protection Agency’s Solar for All program and clean energy tax credits, have been rescinded or weakened.
  • Some states, such as New York and California, still have policies in place to combat climate change and legislators strive to protect these from national-level policies and decrees through the U.S. Climate Alliance.

➑️ Source: Climate Change Performance Index. Ranking

New Technologies in the Energy Sector

In October 2025, the U.S. Department of Energy (DOE) released its Fusion Science and Technology Roadmap

In October 2025, the U.S. Department of Energy (DOE) released its Fusion Science and Technology Roadmap, a national strategy to accelerate the development and commercialization of fusion energy on the most rapid, responsible timeline in history.

➑️ Source: Energy Department Announces Fusion Science and Technology Roadmap to Accelerate Commercial Fusion Power

βœ… What is Nuclear Fusion?

  • Nuclear fusion is the process where two light atomic nuclei combine to form a heavier one, releasing massive amounts of energy.
  • Fusion reactions occur in plasma, a hot, charged gas of ions and free electrons with properties distinct from solids, liquids, or gases.
  • The Sun and all stars are powered by this reaction.

➑️ Source: What is Nuclear Fusion?

β˜‘οΈ Key Takeaways:

πŸ“Œ The Roadmap guides the emerging U.S. fusion private sector toward maturity, targeting actions and milestones through the mid-2030s.

πŸ“Œ Build-Innovate-Grow is DOE’s new strategy to support fusion energy commercialization in the U.S. and its tool is the Roadmap.

πŸ“Œ The Roadmap defines a new era of U.S. fusion energy leadership by setting ambitious goals to deliver fusion power on an aggressive timeline, accelerated by the revolutionary potential of Artificial Intelligence (AI)-Fusion convergence.

πŸ“Œ The Roadmap defines Key Actions to be executed in the near-term (next 2-3 years), mid-term (3-5 years) and long-term (5-10 years), aligned to the Build-Innovate-Grow strategy. DOE will build Fusion Science & Technology infrastructure and the AI-Fusion digital convergence platform.

βœ… Is this A New Era of U.S. Fusion Energy Leadership?

πŸ“Œ The U.S. has led innovation in nuclear fusion since the 1940s with significant fusion research carried out during the Manhattan Project.

πŸ“Œ In the 1950s, the U.S. launched Project Matterhorn under the Atomic Energy Commission (AEC), an effort that later became part of the DOE fusion program.

πŸ“Œ The theoretical framework for compressing and heating fusion fuel using powerful energy drivers was also established through early work in the 1960s and 1970s.

πŸ“Œ Since the early 1990s, the U.S. developed some of the world’s most sophisticated multi-physics computational codes validated with world-leading diagnostic tools on world-class domestic facilities.

πŸ“Œ In the 2000s, fusion technology activity began to grow modestly in the U.S. under the APEX and ALPS programs.

πŸ“Œ In the 2010s the advent of high-performance computing and the understanding of burning plasma physics ushered in a predictive capability that has brought forth confidence in a path forward to the commercialization of fusion energy.

πŸ“Œ Today, the U.S. hosts the fastest-growing private fusion sector, attracting $9B+ in private investment and home to 29 fusion companies, the largest globally, including three with over $1B each.

Pacific Northwest Low-Carbon Hydrogen Analysis

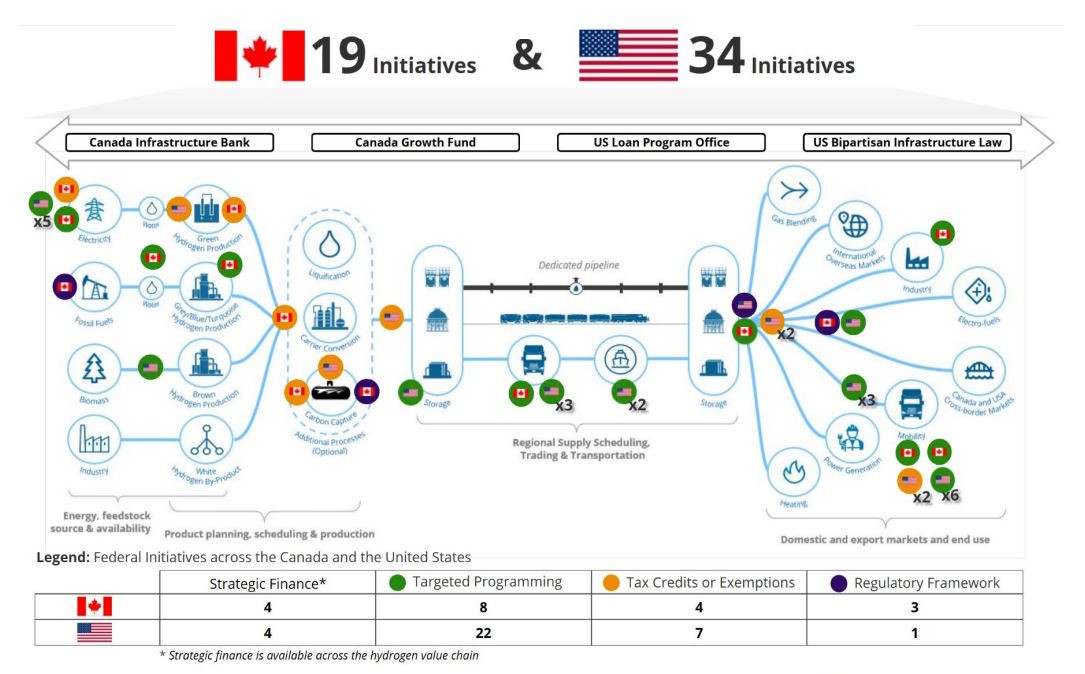
Low-Carbon Hydrogen Analysis. Federal Initiatives across the Canada and the United States. Canada and United States support initiatives and value chain applicability

Figure: Canada and United States support initiatives and value chain applicability

Source: New report: Pacific Northwest Low-Carbon Hydrogen Analysis

Pacific Northwest Low-Carbon Hydrogen Analysis, published by The Pacific Northwest Economic Region (PNWER), provides a comprehensive view of supply, demand and trade opportunities for low-carbon hydrogen between the US and Canada.

βœ… Some takeaways

πŸ“Œ Canada:

  • has a total of 19 direct or indirect support programs available to accelerate the development and deployment of hydrogen technologies and industry across the value chain.
  • Tax measures such as the Clean Hydrogen Investment Tax Credit (ITC), Clean Technology ITC, Clean Technology Manufacturing ITC, and the Carbon Capture, Utilization and Storage (CCUS) ITC are complemented by funding programs such as the Clean Fuels Fund and Strategic Innovation Fund – Net-Zero Accelerator.

πŸ“Œ The US:

  • has a total of 34 direct or indirect federal programs and initiatives across multiple national departments and agencies, which enable the use of hydrogen across the value chain.
  • The US Renewable Fuel Standard (RFS) mandates the blending of renewable fuels into the supply of transportation fuels, with an aim at reducing overall GHG emissions from the sector. While the RFS primarily focuses on biofuels, it also includes provisions for hydrogen derived from renewable feedstocks, like biomass, which generates an economic incentive for the transportation sector to include low-carbon hydrogen in its pathways to decarbonization.

➑️ Source: New report: Pacific Northwest Low-Carbon Hydrogen Analysis

Annual Energy Outlook 2025

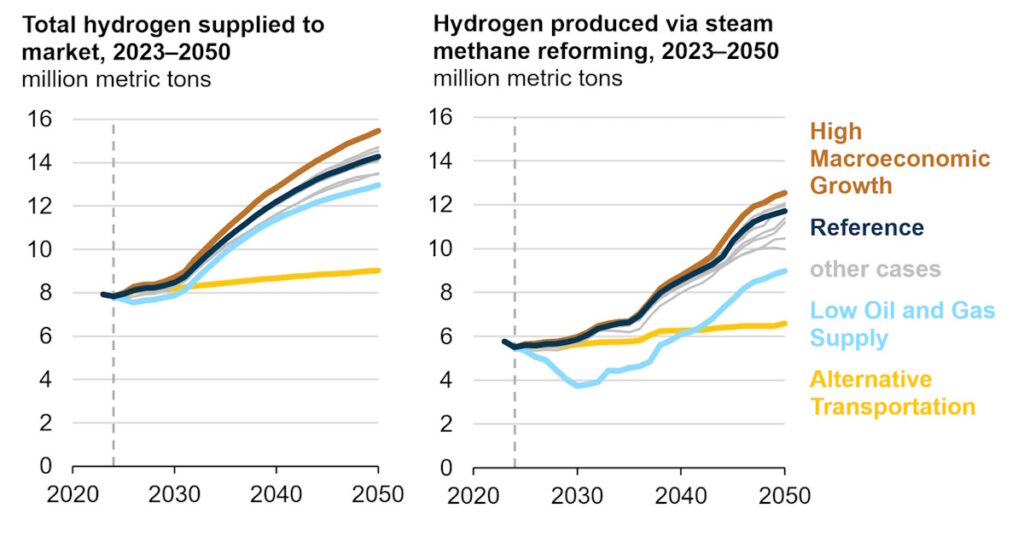
Long-term projections: total hydrogen supplied to market, 2023-2050, hydrogen produced via steam methane reforming, 2023-2050

Figure: Long-term projections for supply and production of hydrogen

Source: Annual Energy Outlook 2025

According to the latest Annual Energy Outlook 2025 by the U.S. Energy Information Administration, even when accounting for the IRA incentives prior to the β€œOne Big Beautiful Bill Act”, hydrogen produced from natural gas remains dominated in the long-term outlook.

πŸ“Š By 2050, the majority of H2 in the U.S. is projected to be produced from natural gas via steam methane reforming (SMR). Less than 1% is expected to come from electrolyzers, despite supportive policies.

➑️ Full analysis: Natural gas remains the largest source of hydrogen in our long-term projections

Yet, this contrasts with the vision laid out in the U.S. National Clean Hydrogen Strategy and Roadmap, which foresees a more diverse production mix β€” including electrolysis, fossil-based hydrogen with CCS, and biomass/waste-derived hydrogen, playing key roles through at least 2050.

The key takeaway: Ambition and reality are still not fully aligned, when it comes to scaling up green hydrogen.

➑️ Source: U.S. National Clean Hydrogen Strategy and Roadmap

IEA World Energy Investment 2025 Report

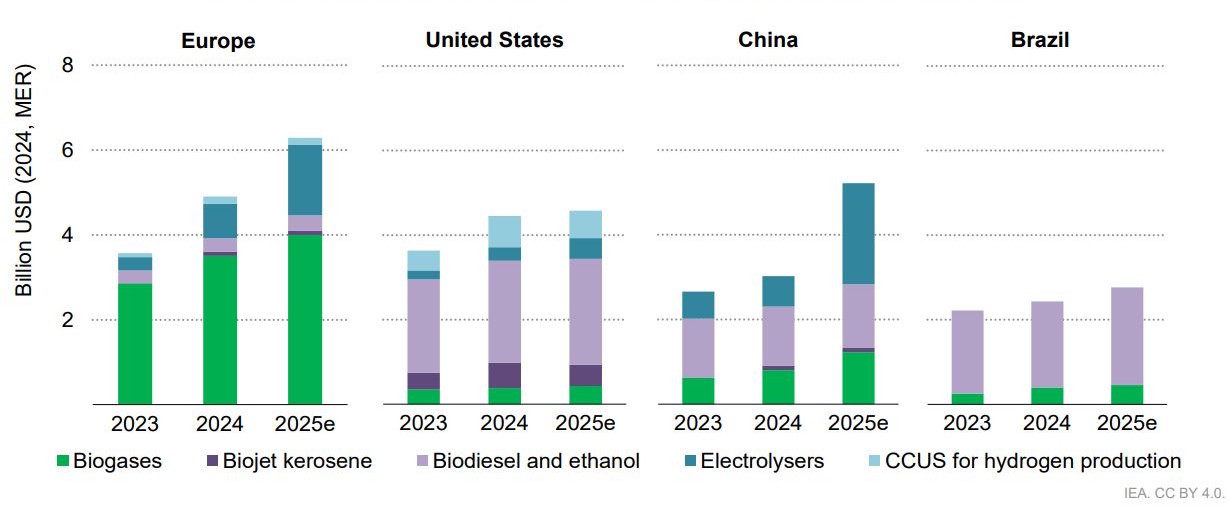
investment in selected low-emissions fuels in selected regions, 2023, 2024 and 2025

Figure: Investment in selected low-emissions fuels in selected regions, 2023, 2024 and 2025

Source: World Energy Investment 2025 report, 10th Edition

Investment in liquid biofuels, biogases and hydrogen is set to rise by 30 % in 2025, to nearly $25 billion, building on a 20 % rise in 2024.

πŸ“Œ Low-emissions fuel spending varies greatly by region:

  • in 2024, Europe accounted for 60% of global investment in biogases;
  • the US made up 70% of global investment in biojet kerosene;
  • China has large investments in hydrogen;
  • Brazil focuses on liquid biofuels.

πŸ“Œ Investment in liquid biofuels, biogases and low-emissions hydrogen is set to rise by 30% in 2025 to a record high close to USD 25 billion, building on a 20% rise in 2024.

πŸ“Œ Policies and regulations remain essential to this growth: mandates, quotas and other forms of policy support have underpinned the high levels of investment in biodiesel and ethanol in the United States and Brazil and in biogases in Europe.

πŸ“Œ Some hydrogen projects have been cancelled or delayed in the past 12 months, but there remains a pipeline of projects that have received FID, requiring around USD 8 billion of investment in 2025, a 70% increase from the level in 2024.

πŸ“Œ For hydrogen:

  • there were a number of setbacks for projects around the world, nonetheless, investment rose by 60% in 2024, and there remains a large pipeline of hydrogen production projects that have received FID.
  • government support has continued in 2025 globally, for example, in Australia and the EU.
  • all hydrogen projects that have received FID would require investment almost USD 8 billion and would increase capacity to around 7.5 Mt in 2035.

➑️ Source: World Energy Investment 2025 report, 10th Edition

Legislative Update – U.S. Energy Tax Incentives

The One, Big, Beautiful Bill

πŸ“’ Legislative Update – U.S. Energy Tax Incentives

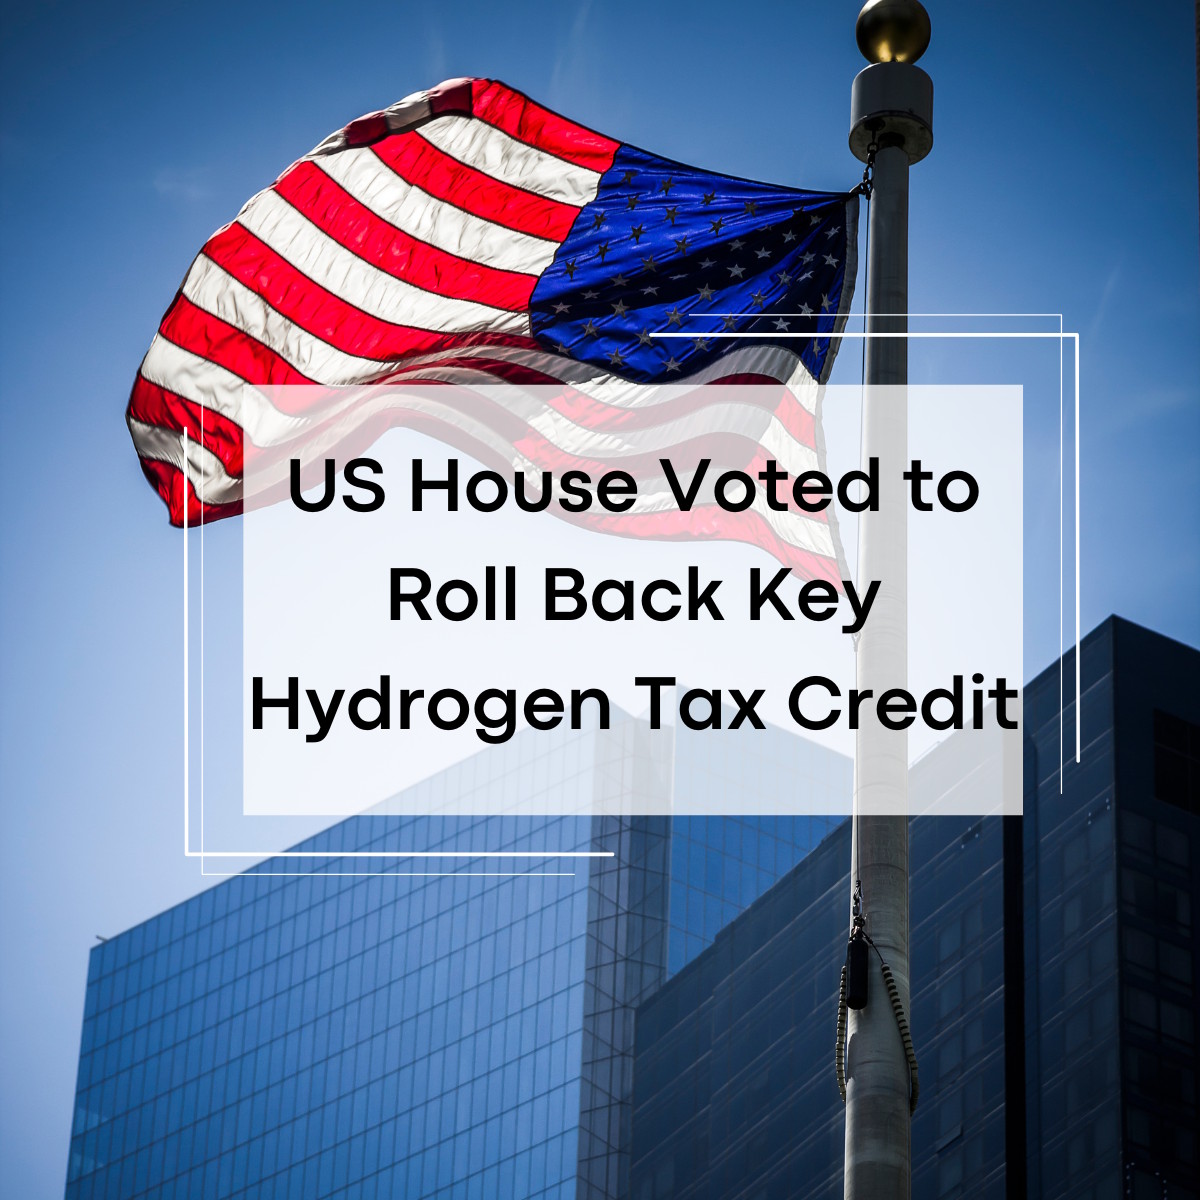
On May 22, 2025, the U.S. House of Representatives passed β€œThe One, Big, Beautiful Bill” (Bill) β€” legislation that proposes significant changes to energy-related tax incentives originally introduced under the Inflation Reduction Act.

➑️ Key Changes for Hydrogen:

❌ The Clean Hydrogen Production Tax Credit (IRC §45V) would be terminated for facilities that begin construction after December 31, 2025.

βœ… The Clean Fuel Production Credit (Β§45Z) β€” supporting the production of low-carbon transportation fuels including hydrogen β€” would be extended from December 31, 2027, to December 31, 2031.

β˜‘οΈ What’s Next?

  • The Bill now moves to the Senate, where further amendments are expected.
  • Final passage timing remains uncertain β€” but August appears more realistic than the previously anticipated July 4 timeline.

πŸ“„ Full text of the Bill

➑️ Source: The β€œOne, Big, Beautiful Bill” – Summary of Renewable Energy Tax Provisions